
Raspberry Pi Monitoring and Dashboard (Good for Any Linux Device)
I have created a simple monitoring tool for multiple RPi devices with a dashboard. My need for monitoring stems from a fact that I use multiple Raspberry Pis for different purposes such as dashboards. Sometimes they would crash or be unavailable (disconnected from a network). This monitoring script addresses that as it offers real-time dashboard.
The number of devices you can monitor is unlimited and they don’t have to be Raspberry Pis only. It works with standard Linux devices as well such as servers, laptops or similar. The tool is configurable and can report anything as it runs commands from bash / cli / terminal run.
Data reported = any Linux command will work
It reports these data by default:
- hostname
- CPU temperature
- network IP address
- ping results
- running browser (only Firefox and Chromium are checked at the moment)
- optionally also a screenshot of current graphical X display (using scrot)
It can report anything as commands are defined as standard bash commands and are fully configurable in config file. Full output can be reported or output can be searched for strings to match and only matching lines will be reported in the Raspberry Pi monitoring dashboard.

Architecture
The whole monitoring is as simple as possible and consists of two files (+two configs).
One file is meant to be used at a server and works both as a data receiver and dashboard written in PHP and comes with a config file.
File for RPi is a client reporting script written in Python and comes with a TOML config file.
Browser authentication is optional, you can set username and password to require login before dashboard display. Simple Digest browser authentication (secure SHA256, not MD5!) is used to secure the dashboard page.
Easy Monitoring Configuration Updates in Dashboard
Version 2 offers easy configuration updates for remote devices that you want to monitor. Now you don’t have to log in to each individual device to provide a configuration update, i.e. change what you want to have reported. You can easily push updates from the dashboard either to an individual device or all devices at once. How great and easy is that?
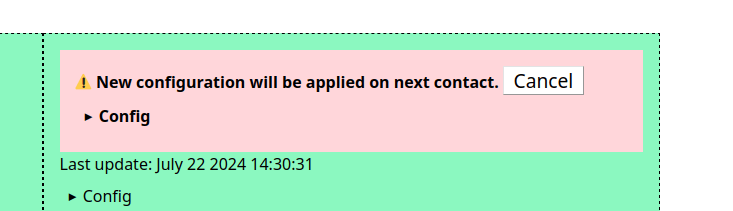
One-time Commands and Reporting Code Auto Updates
Version 3 includes running one-time commands as well as automatic updates of the reporting code on client devices. Dashboard now visually differentiates with red background unresponsive devices that have not reported home for longer than usually. That makes it easier to spot devices that have issues. Automatic Python code updates are experimental and pulled from Github main branch.
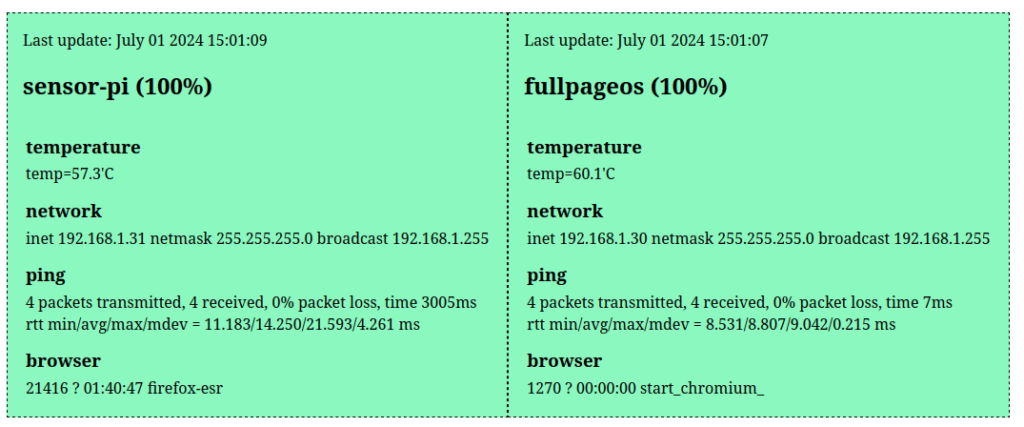
RPi Dashboard
The monitoring dashboard looks like this:
Open Source Monitoring with Dashboard
This Raspberry Pi (and Linux) tool for monitoring with a dashboard is fully open source (MIT license). It works for any Raspberry Pi such as Zero, Zero W, 1, 2, 3, 4 or 5 including any models versions such as B or B+. It won’t work for Pico as it does not run standard Linux operating system.
Good for any Linux device (not just Raspberry Pis!)
The monitoring works for any Linux device as well, not only RPis as it uses standard bash commands for reporting values such as network, CPU temperature, voltage, display etc. back. You can use any command for monitoring to be displayed on the dashboard as the software is fully configurable.
Embedded and IoT device monitoring
This tool can be used also to monitor embedded devices running Linux (or just having support for Python) as well as IoT devices such as sensors, displays and similar hardware. The only condition is that these devices must have access to internet, e.g. using ethernet LAN cable, wireless or a SIM card. Permanent connection is not required, but connection must be available before Python reporting script is called.
Download
You can download RPi Monitor Dashboard from my Github repo under MIT License.
Do you require a hosted monitoring service?
I can set it up for you for a monthly fee. Get in touch.
Comments or tips?
Let me know if you decided to use it and of course, any improvements via pull requests are welcome.